When Synthetic Data Works (And When It Doesn't): An Independent Validation
Published on
January 14, 2026
Written by
Leo Gotheil
.png)
Table of contents
Synthetic data augmentation has become one of market research's most discussed innovations. But does synthetic data work for small sample sizes? This independent validation study by Dig Insights tested Fairgen's synthetic augmentation method across 28,630 respondents in two contrasting datasets—answering when sample augmentation improves accuracy, when it doesn't, and what conditions matter most.
The promise is compelling: faster timelines, access to hard-to-reach audiences, and relief from relentless cost pressure. But trust hasn't kept pace with the hype.
Most claims about synthetic data lack independent validation. "Proof" typically comes from vendor-led studies, single datasets, or cherry-picked metrics. For insights leaders evaluating whether to adopt these methods, this creates a credibility gap. The question isn't just "does it work?" but "when does it work, under what conditions, and with what limitations?"
This article examines an independent, multi-metric validation that aimed to answer exactly those questions—and set a new standard for how synthetic data methodologies should be tested.
Key Findings
Validator: Dig Insights (independent research consultancy with no commercial ties to Fairgen)
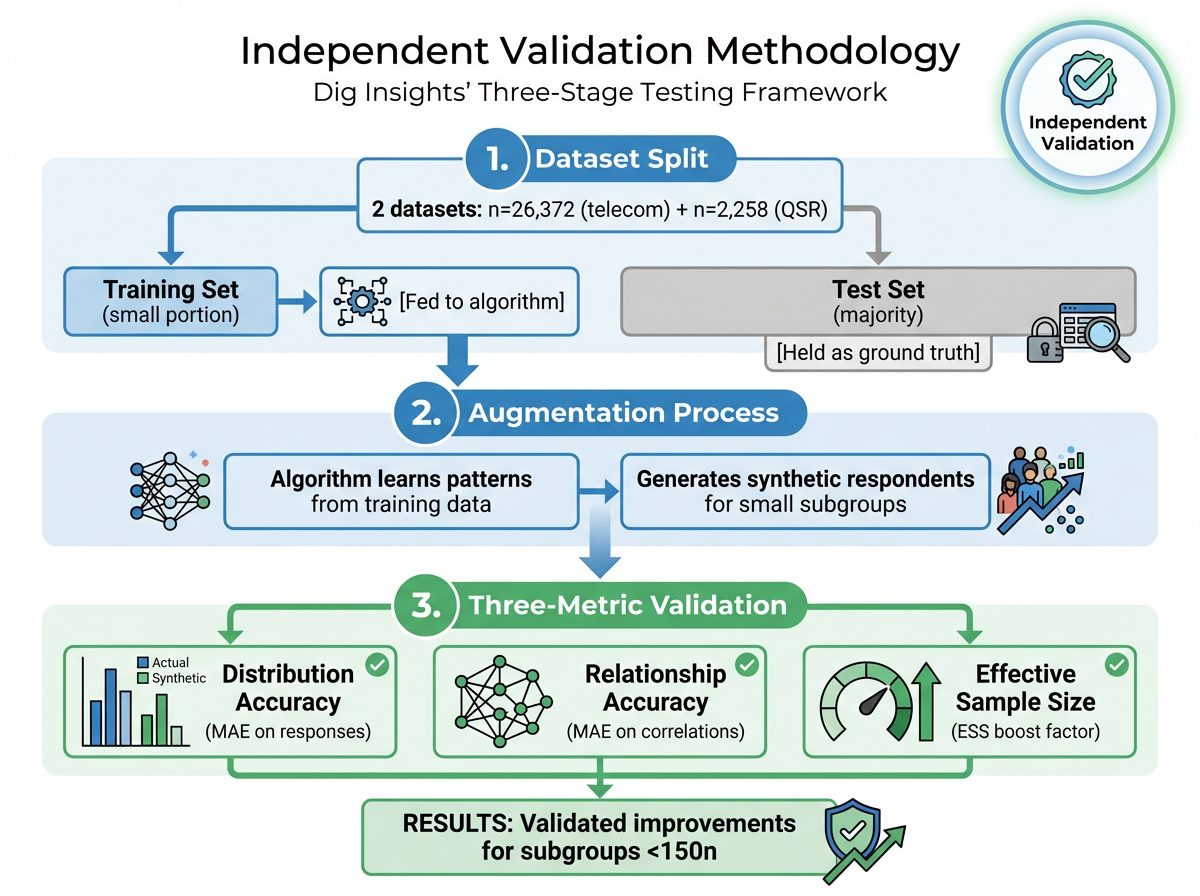
Test scope: 28,630 respondents across two contrasting datasets—telecom study (n=26,372) and QSR study (n=2,258)
Methodology: Holdout validation using train/test split. Three complementary metrics: distribution accuracy (MAE), correlation preservation, and effective sample size (ESS).
Results: Error rates dropped up to 2.5 percentage points for subgroups under 50 respondents. Effective sample size increased 153-165% for smallest segments (n=10-40). Mid-sized groups (150+ respondents) showed minimal benefit.
What this enables: Reliable analysis of intersectional segments previously "too small to study." Local market tracking, niche audience segmentation, and portfolio brand analysis become feasible without additional fieldwork or timeline extensions.
Requirements: Minimum 300+ respondents in full dataset. Clean, well-structured quantitative data. Works best on subgroups under 150 respondents. Datasets with fundamental quality issues amplify noise rather than signal.
What Dig Insights Tested: Synthetic Data Validation Methodology
It's important to be precise about what type of synthetic data we're discussing.
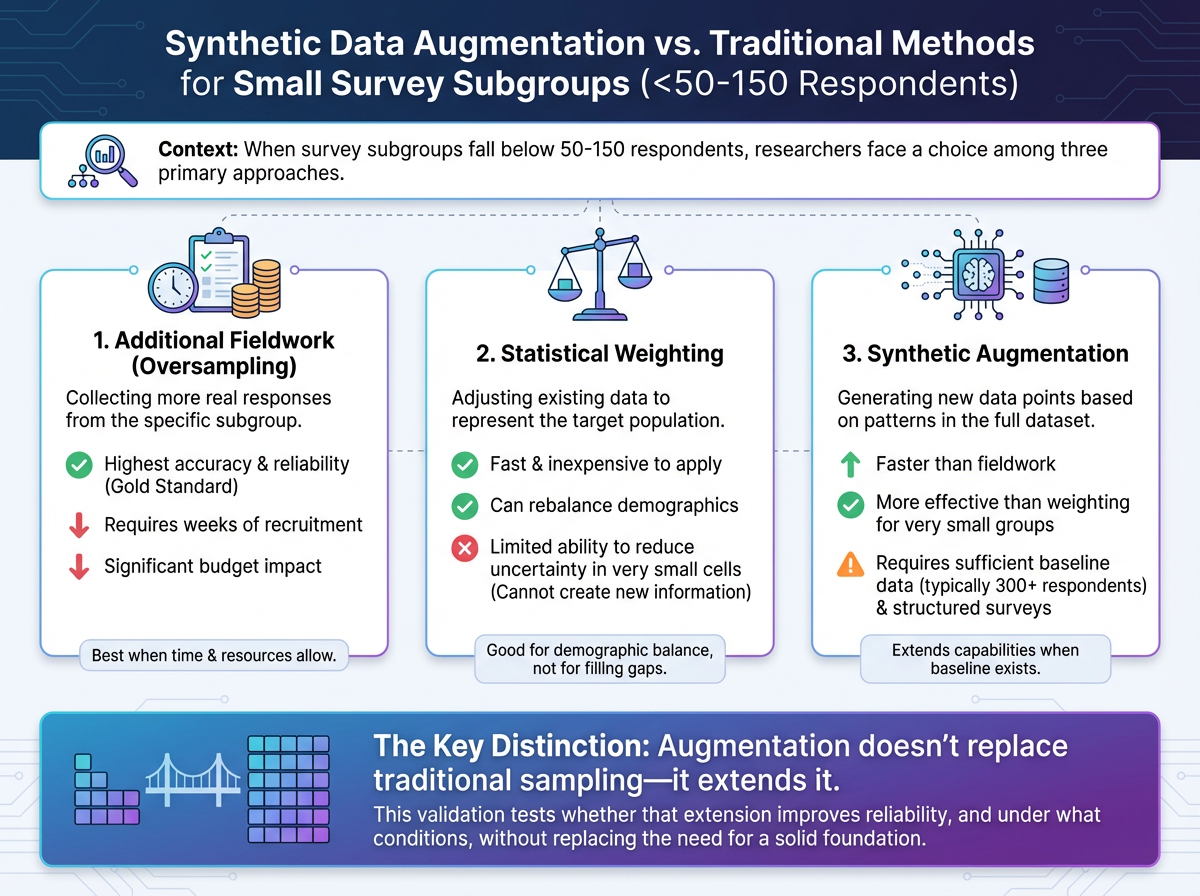
The validation focused on augmentation—strengthening small, real-world subsamples (15-350 respondents) by generating additional synthetic respondents based on patterns learned from the broader dataset. This approach, developed by Fairgen, is fundamentally different from:
- Fully synthetic respondents generated from scratch by large language models
- Replacement of traditional survey collection
- Simulated interview participants
Dig Insights, a research consultancy, conducted this validation independently with no commercial ties to the technology provider. The independence structure was deliberate: Dig maintained full control over methodology design, execution, and publication rights, with pre-agreed transparency regardless of outcome. This separation helps address a common challenge in synthetic data validation—most published studies are conducted or funded by the technology vendors themselves, which can introduce selection bias in what gets tested and what gets published.
The validation examined a hybrid quantitative approach—combining real survey data with AI-augmented samples for small subgroups. This method addresses a recurring challenge in market research: how to draw reliable insights from niche audience segments when traditional sample sizes prove insufficient.
How the Validation Worked
The validation tested whether synthetic augmentation could improve accuracy and effective sample size of small subgroups without compromising research quality.
Two Contrasting Datasets
- Large telecom study: 26,372 respondents
- Smaller QSR (quick-service restaurant) study: 2,258 respondents
This contrast allowed evaluation under different conditions—exactly the kind of variation researchers face in practice.
Subgroups That Matter
The test focused on audiences researchers struggle to analyze:
Telecom study:
- Saskatchewan residents (n=21)
- Nova Scotia residents (n=40)
- 18-24 year-olds (n=157)
- Newcomers (n=198)
- Specific behavioral segments
QSR study:
- Young adults ≤21 (n=10)
- Adults 60+ (n=35)
- Rare visitors
- Asian/Pacific Islanders
- High-income respondents
Train/Test Separation
Each dataset was split. The training set fed the algorithm to learn patterns. The test set—never exposed to the algorithm—served as ground truth for comparison. This prevents the common validation pitfall of testing on the same data used for training.
Three Complementary Metrics
Distribution accuracy: Do boosted responses align more closely with true results from the larger dataset? Measured by Mean Absolute Error (MAE) on response distributions. Lower MAE means less error.
Relationship accuracy: Do patterns between variables hold up more reliably? Measured by MAE on correlations. For example, if age predicts fast-food visits in the full dataset, does that pattern strengthen in small subgroups after boosting?
Effective Sample Size (ESS): How much does reliability improve, translated into sample size terms? If boosting makes results from 20 people behave as reliably as results from 50, the ESS boost factor is 2.5x.
By examining numbers, patterns, and effective size, the validation ensured improvements weren't cosmetic—they needed to make data more reliable for real-world decisions.
Validation Results: When Synthetic Augmentation Improves Small Sample Accuracy
Small Subgroups Benefited Most
In the telecom study, Saskatchewan (n=21) cut error rates by 2.5 percentage points and more than doubled its effective sample size (+153%). Nova Scotia (n=40) saw similar gains (+165% ESS increase). Groups that were "too small to study" became analyzable with acceptable confidence intervals.
📊 What this means for researchers: When error drops from 15% to 8% for a subsample of 30, it shifts from "directional guidance" to "reliable enough for resource allocation decisions."
This isn't just theoretical. When T-Mobile needed granular brand tracking data for local markets, they faced exactly this challenge. Traditional nationally-balanced surveys gave them insights on only 21 major markets—covering just 35% of the U.S. adult population. Using Fairgen's augmentation approach, T-Mobile expanded their actionable insights to 98 markets, covering 70% of the population, enabling local marketing teams to make data-driven decisions that were previously impossible.
In the QSR study, every subgroup improved. Young adults (n=10) and older adults (n=35) both saw effective sample sizes roughly triple. Average error dropped from 11.1% to 7.6% across all segments.
Patterns Held Up Better
Correlation accuracy improved across both studies. The relationships between variables (age and behavior, income and preferences) became more reliable after augmentation. In the QSR study, correlation error fell by 0.08 on average—meaning patterns that were distorted by small sample noise moved closer to their true values.
🔗 What this means for researchers: Preserved correlations keep segmentation models stable when cutting data. Relationships between demographics and behavior don't distort under small sample conditions.
Practical Translation: Doubling Effective Sample Size
The most useful way to understand these results: augmentation often made small subgroups behave like they had twice as many respondents. That means narrower confidence intervals, more stable estimates, and greater confidence in insights drawn from niche audiences.
📈 What this means for researchers: A subsample of 30 that behaves like 60 moves from unusable to actionable. Narrower confidence intervals enable local market decisions previously impossible.
This addresses a real operational problem. When subgroup analysis is limited by small n's, researchers face three options: accept high margins of error, invest in additional fieldwork, or skip the analysis entirely. Validated augmentation provides a fourth option—under the right conditions.
Real-World Applications
L'Oréal faced this exact dilemma with their brand portfolio. Smaller brands within their portfolio had insufficient sample sizes for granular insights—budgets couldn't justify separate studies per brand, but portfolio strategy required detailed understanding of each brand's users. Through validated augmentation, L'Oréal expanded samples for five niche brand segments, turning groups ranging from n=22 to n=66 into samples of n=66 to n=156—making the "impossible trade-off between budget and insights depth" solvable.
When Synthetic Data Augmentation Fails: Documented Limitations
This section is non-negotiable. Understanding where augmentation fails is as important as knowing where it succeeds.
Mid-Sized Groups Showed Little Improvement
In the telecom study, 18-24 year-olds (n=157) and newcomers (n=198) showed essentially no benefit. Error rates stayed flat or slightly increased. Effective sample size changed by less than 20%.
This reveals an important boundary: augmentation works best on the smallest subgroups. Once a subsample reaches a certain size (roughly 150-200 respondents in these studies), the marginal gains from augmentation diminish or disappear.
Weak Input Data Amplifies Noise
Synthetic augmentation works by having statistical models automatically identify underlying patterns in your broader dataset—relationships between demographics, behaviors, and responses that exist across your full sample. The model then uses these discovered patterns to generate reliable synthetic respondents for small subgroups.
This means researchers don't need to manually identify correlations or relationships before augmentation. The statistical models handle pattern discovery automatically. However, the models can only work with what exists in the data. If the starting dataset is poorly structured, has significant data quality issues, or lacks sufficient variable coverage, there aren't meaningful patterns for the model to learn from. In those cases, augmentation risks amplifying noise rather than signal.
This is why ensuring data quality before augmentation has become a critical first step—catching bad data from bots, speeders, inattentive respondents, and low-quality open-ended responses before it enters the augmentation process.
⚠️ Requirements for Reliable Augmentation
Minimum baseline:
- ✓ 300+ respondents in full dataset
- ✓ Clean data (no significant fraud/speeder issues)
- ✓ Well-structured quantitative survey
- ✓ Sufficient variable coverage for pattern learning
Optimal conditions:
- ✓ Subgroups under 50 respondents
- ✓ Multiple filters creating intersectional segments
- ✓ Clear business need for niche segment analysis
Not suitable for:
- ✗ Mid-sized groups (150+ respondents)
- ✗ Datasets with fundamental quality issues
- ✗ Very small studies (under 300 total respondents)
- ✗ Sparse cells with no pattern signal in broader data
Scope Limitations
The validation examined distribution accuracy and pairwise correlations. It did not test:
- Time-series or longitudinal data
- Open-ended or qualitative responses
- Certain advanced use cases
Augmentation may perform differently in these contexts. Researchers applying augmentation to these scenarios should conduct appropriate validation for their specific use case.
Note on scope: This validation focused on distribution accuracy and pairwise correlations. Independent studies by GIM (tracking studies), L'Oréal + IFOP (segmentation models), and Google (qualitative applications) have since explored time-series data, complex multivariable models, and other use cases. For readers interested in these specific contexts, our complete validation library is available.
Frequently Asked Questions About Synthetic Data Validation
Does synthetic data work for market research?
Yes, but with specific conditions. Independent validation showed synthetic augmentation improves accuracy for subgroups under 150 respondents, often doubling effective sample size. Mid-sized groups (150+ respondents) showed minimal benefit. The method works best when you need to analyze intersectional segments where multiple demographic or behavioral filters reduce sample sizes to unusable levels.
What is the difference between synthetic data and augmented data?
Augmented data strengthens small real-world subsamples by adding synthetic respondents based on patterns learned from the broader dataset. Fully synthetic data is generated entirely from scratch by AI models without any real respondent foundation. This validation tested augmentation, not fully synthetic data. Augmentation maintains connection to real survey responses while synthetic generation creates entirely artificial data points.
How accurate is synthetic data for small samples?
In validated testing, synthetic augmentation reduced error rates by up to 2.5 percentage points for very small groups (n=21) and increased effective sample size by 153-165%. Groups with n=10 saw effective sample sizes roughly triple. The accuracy improvement is most dramatic for subgroups under 50 respondents, with diminishing returns as sample sizes approach 150-200 respondents.
When should you NOT use synthetic data augmentation?
Avoid synthetic augmentation for:
- Mid-sized subgroups with 150+ respondents (minimal benefit)
- Datasets with fundamental quality issues (amplifies noise rather than signal)
- Studies with insufficient baseline data (under 300 respondents in full dataset)
- When confidence intervals are already acceptable (augmentation adds limited value)
If your starting data has poor collection practices, high fraud rates, or structural problems, address data quality first before considering augmentation.
Has synthetic data been independently validated?
Yes. Fairgen received multiple independent validations from leading market researchers from top brands and MRX agencies:
- Dig Insights (distribution accuracy and pairwise correlations)
- GIM (tracking studies and longitudinal data stability)
- L'Oréal + IFOP (enterprise-scale segmentation models)
- Google (qualitative applications and concept testing)
Each validation was conducted with full methodological control by the independent party and pre-agreed transparent publication of all findings, including limitations.
What validation metrics should I look for when evaluating synthetic data?
Look for these three complementary metrics:
- Distribution accuracy (MAE) - How closely do synthetic responses match real distributions?
- Relationship accuracy (correlation MAE) - Do patterns between variables hold up reliably?
- Effective Sample Size (ESS) - How much does statistical reliability improve?
Be skeptical of vendors showing only one metric or using proprietary "accuracy scores" without transparent methodology. Independent validation should use train/test splits to prevent overfitting.
Is this LLM-generated synthetic data?
No. This validation tested statistical augmentation based on patterns learned from real survey data—not large language model outputs. The approach doesn't use ChatGPT, Claude, or other LLMs to generate respondent personas. Statistical models identify relationships in the observed data and use those patterns to create synthetic data points that preserve distributional and correlational properties.
Does augmentation use external data sources?
No. Augmentation works entirely within your collected survey data. The algorithm learns patterns from the broader dataset (how demographics relate to behaviors and attitudes in your full sample) and applies those patterns to small subgroups. No external panels, social media data, or third-party sources are used.
When to Use Synthetic Data Augmentation: Decision Guidelines for Market Researchers
Based on these findings, here are rules of thumb for when to consider synthetic augmentation:
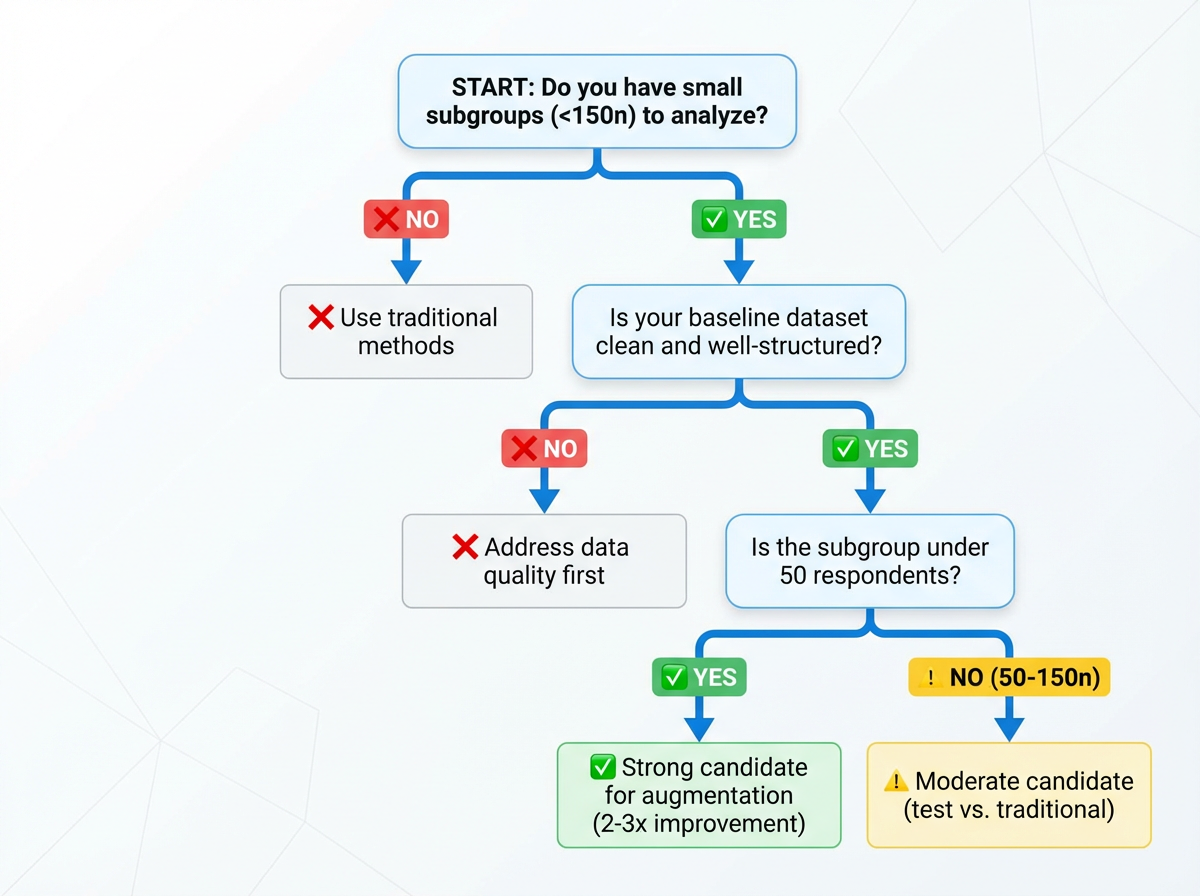
When It Makes Sense
Underrepresented samples with multiple filters:
The classic augmentation scenario:
- Start with nationally representative sample (n=2,000)
- Apply demographic filter: female respondents (50% → n=1,000)
- Age filter: 25-34 years old (15% → n=150)
- Income filter: $100k+ (5% → n=75)
- Geographic filter: Pacific Northwest (2% → n=15)
- Behavioral filter: frequent travelers (0.5% → n=7)
Augmentation turns n=7 "too small to analyze" into reliable subgroups.
Clear business need for niche segment analysis: When portfolio strategy, local market decisions, or product development require granular insights on specific audiences that traditional sample sizes can't support.
Well-structured quantitative data: Survey data with sufficient variable coverage where the augmentation algorithm can learn meaningful patterns. The models automatically discover relationships—you don't need to identify correlations yourself—but they need quality data to work with.
Transparent methodology requirements: Augmentation is fully explainable to stakeholders. The validation framework, statistical approach, and confidence intervals can be documented and shared, making it suitable for organizations that require methodological transparency in their research processes.
When to Avoid It
Mid-sized subgroups that are already adequate: Groups with 150+ respondents typically show minimal improvement from augmentation. If your confidence intervals are already acceptable, augmentation adds limited value.
Datasets with fundamental quality issues: If the underlying data suffers from poor collection practices, high fraud rates, or structural problems, augmentation won't fix these issues—it will amplify them. Address data quality first.
Extremely limited baseline data: Augmentation requires sufficient starting data (typically 300+ respondents in the full dataset) to learn patterns. Very small studies lack the foundation for reliable augmentation.
Questions to Ask Vendors
- What independent validation exists for your specific approach?
- On what types of data and subgroup sizes does your method work best?
- What are the documented failure conditions?
- How do you handle operational complexity of multiple boosts?
- What transparency do you provide about the augmentation methodology?
- How are stakeholders typically briefed on the approach?
Internal Checks to Run
- Compare boosted results to unboosted on a held-out sample
- Examine whether patterns align with known relationships from other research
- Document when and where augmentation was applied
- Monitor for signs of overfitting or unrealistic precision
- Prepare clear explanations of the methodology for stakeholder review
Conclusion
Across two different datasets, synthetic augmentation consistently improved accuracy and reliability in small subgroups. Distribution accuracy and relationship stability both benefited, with effective sample sizes often doubling. This means researchers can draw faster, more confident insights from niche audiences without additional fieldwork.
At the same time, clear boundaries exist. The method works best with well-structured starting data; datasets with fundamental quality issues risk amplifying noise rather than signal. Mid-sized groups showed little improvement.
What makes this validation significant isn't just the results—it's the standard it sets. In an industry where most synthetic data vendors rely on their own case studies and limited metrics, Fairgen submitted to independent, transparent validation with pre-agreed publication of all findings, including limitations. That level of methodological rigor is currently unique in the market research industry.
For insights leaders evaluating synthetic data vendors, this validation provides a clear decision framework. Fairgen's augmentation approach has been independently tested across multiple datasets, metrics, and conditions. The boundaries are documented. The failure modes are known. The improvements are quantified. The methodology can be transparently explained to stakeholders and clients.
Synthetic augmentation is a precision tool, not a universal solution. It works under specific conditions—particularly when you need to analyze intersectional segments where multiple filters reduce sample sizes to unusable levels. Trust comes from transparent validation, not vendor claims.
Synthetic data augmentation has become one of market research's most discussed innovations. But does synthetic data work for small sample sizes? This independent validation study by Dig Insights tested Fairgen's synthetic augmentation method across 28,630 respondents in two contrasting datasets—answering when sample augmentation improves accuracy, when it doesn't, and what conditions matter most.
The promise is compelling: faster timelines, access to hard-to-reach audiences, and relief from relentless cost pressure. But trust hasn't kept pace with the hype.
Most claims about synthetic data lack independent validation. "Proof" typically comes from vendor-led studies, single datasets, or cherry-picked metrics. For insights leaders evaluating whether to adopt these methods, this creates a credibility gap. The question isn't just "does it work?" but "when does it work, under what conditions, and with what limitations?"
This article examines an independent, multi-metric validation that aimed to answer exactly those questions—and set a new standard for how synthetic data methodologies should be tested.
Key Findings
Validator: Dig Insights (independent research consultancy with no commercial ties to Fairgen)
Test scope: 28,630 respondents across two contrasting datasets—telecom study (n=26,372) and QSR study (n=2,258)
Methodology: Holdout validation using train/test split. Three complementary metrics: distribution accuracy (MAE), correlation preservation, and effective sample size (ESS).
Results: Error rates dropped up to 2.5 percentage points for subgroups under 50 respondents. Effective sample size increased 153-165% for smallest segments (n=10-40). Mid-sized groups (150+ respondents) showed minimal benefit.
What this enables: Reliable analysis of intersectional segments previously "too small to study." Local market tracking, niche audience segmentation, and portfolio brand analysis become feasible without additional fieldwork or timeline extensions.
Requirements: Minimum 300+ respondents in full dataset. Clean, well-structured quantitative data. Works best on subgroups under 150 respondents. Datasets with fundamental quality issues amplify noise rather than signal.
What Dig Insights Tested: Synthetic Data Validation Methodology
It's important to be precise about what type of synthetic data we're discussing.
The validation focused on augmentation—strengthening small, real-world subsamples (15-350 respondents) by generating additional synthetic respondents based on patterns learned from the broader dataset. This approach, developed by Fairgen, is fundamentally different from:
- Fully synthetic respondents generated from scratch by large language models
- Replacement of traditional survey collection
- Simulated interview participants
Dig Insights, a research consultancy, conducted this validation independently with no commercial ties to the technology provider. The independence structure was deliberate: Dig maintained full control over methodology design, execution, and publication rights, with pre-agreed transparency regardless of outcome. This separation helps address a common challenge in synthetic data validation—most published studies are conducted or funded by the technology vendors themselves, which can introduce selection bias in what gets tested and what gets published.
The validation examined a hybrid quantitative approach—combining real survey data with AI-augmented samples for small subgroups. This method addresses a recurring challenge in market research: how to draw reliable insights from niche audience segments when traditional sample sizes prove insufficient.
How the Validation Worked
The validation tested whether synthetic augmentation could improve accuracy and effective sample size of small subgroups without compromising research quality.
Two Contrasting Datasets
- Large telecom study: 26,372 respondents
- Smaller QSR (quick-service restaurant) study: 2,258 respondents
This contrast allowed evaluation under different conditions—exactly the kind of variation researchers face in practice.
Subgroups That Matter
The test focused on audiences researchers struggle to analyze:
Telecom study:
- Saskatchewan residents (n=21)
- Nova Scotia residents (n=40)
- 18-24 year-olds (n=157)
- Newcomers (n=198)
- Specific behavioral segments
QSR study:
- Young adults ≤21 (n=10)
- Adults 60+ (n=35)
- Rare visitors
- Asian/Pacific Islanders
- High-income respondents
Train/Test Separation
Each dataset was split. The training set fed the algorithm to learn patterns. The test set—never exposed to the algorithm—served as ground truth for comparison. This prevents the common validation pitfall of testing on the same data used for training.
Three Complementary Metrics
Distribution accuracy: Do boosted responses align more closely with true results from the larger dataset? Measured by Mean Absolute Error (MAE) on response distributions. Lower MAE means less error.
Relationship accuracy: Do patterns between variables hold up more reliably? Measured by MAE on correlations. For example, if age predicts fast-food visits in the full dataset, does that pattern strengthen in small subgroups after boosting?
Effective Sample Size (ESS): How much does reliability improve, translated into sample size terms? If boosting makes results from 20 people behave as reliably as results from 50, the ESS boost factor is 2.5x.
By examining numbers, patterns, and effective size, the validation ensured improvements weren't cosmetic—they needed to make data more reliable for real-world decisions.
Validation Results: When Synthetic Augmentation Improves Small Sample Accuracy
Small Subgroups Benefited Most
In the telecom study, Saskatchewan (n=21) cut error rates by 2.5 percentage points and more than doubled its effective sample size (+153%). Nova Scotia (n=40) saw similar gains (+165% ESS increase). Groups that were "too small to study" became analyzable with acceptable confidence intervals.
📊 What this means for researchers: When error drops from 15% to 8% for a subsample of 30, it shifts from "directional guidance" to "reliable enough for resource allocation decisions."
This isn't just theoretical. When T-Mobile needed granular brand tracking data for local markets, they faced exactly this challenge. Traditional nationally-balanced surveys gave them insights on only 21 major markets—covering just 35% of the U.S. adult population. Using Fairgen's augmentation approach, T-Mobile expanded their actionable insights to 98 markets, covering 70% of the population, enabling local marketing teams to make data-driven decisions that were previously impossible.
In the QSR study, every subgroup improved. Young adults (n=10) and older adults (n=35) both saw effective sample sizes roughly triple. Average error dropped from 11.1% to 7.6% across all segments.
Patterns Held Up Better
Correlation accuracy improved across both studies. The relationships between variables (age and behavior, income and preferences) became more reliable after augmentation. In the QSR study, correlation error fell by 0.08 on average—meaning patterns that were distorted by small sample noise moved closer to their true values.
🔗 What this means for researchers: Preserved correlations keep segmentation models stable when cutting data. Relationships between demographics and behavior don't distort under small sample conditions.
Practical Translation: Doubling Effective Sample Size
The most useful way to understand these results: augmentation often made small subgroups behave like they had twice as many respondents. That means narrower confidence intervals, more stable estimates, and greater confidence in insights drawn from niche audiences.
📈 What this means for researchers: A subsample of 30 that behaves like 60 moves from unusable to actionable. Narrower confidence intervals enable local market decisions previously impossible.
This addresses a real operational problem. When subgroup analysis is limited by small n's, researchers face three options: accept high margins of error, invest in additional fieldwork, or skip the analysis entirely. Validated augmentation provides a fourth option—under the right conditions.
Real-World Applications
L'Oréal faced this exact dilemma with their brand portfolio. Smaller brands within their portfolio had insufficient sample sizes for granular insights—budgets couldn't justify separate studies per brand, but portfolio strategy required detailed understanding of each brand's users. Through validated augmentation, L'Oréal expanded samples for five niche brand segments, turning groups ranging from n=22 to n=66 into samples of n=66 to n=156—making the "impossible trade-off between budget and insights depth" solvable.
When Synthetic Data Augmentation Fails: Documented Limitations
This section is non-negotiable. Understanding where augmentation fails is as important as knowing where it succeeds.
Mid-Sized Groups Showed Little Improvement
In the telecom study, 18-24 year-olds (n=157) and newcomers (n=198) showed essentially no benefit. Error rates stayed flat or slightly increased. Effective sample size changed by less than 20%.
This reveals an important boundary: augmentation works best on the smallest subgroups. Once a subsample reaches a certain size (roughly 150-200 respondents in these studies), the marginal gains from augmentation diminish or disappear.
Weak Input Data Amplifies Noise
Synthetic augmentation works by having statistical models automatically identify underlying patterns in your broader dataset—relationships between demographics, behaviors, and responses that exist across your full sample. The model then uses these discovered patterns to generate reliable synthetic respondents for small subgroups.
This means researchers don't need to manually identify correlations or relationships before augmentation. The statistical models handle pattern discovery automatically. However, the models can only work with what exists in the data. If the starting dataset is poorly structured, has significant data quality issues, or lacks sufficient variable coverage, there aren't meaningful patterns for the model to learn from. In those cases, augmentation risks amplifying noise rather than signal.
This is why ensuring data quality before augmentation has become a critical first step—catching bad data from bots, speeders, inattentive respondents, and low-quality open-ended responses before it enters the augmentation process.
⚠️ Requirements for Reliable Augmentation
Minimum baseline:
- ✓ 300+ respondents in full dataset
- ✓ Clean data (no significant fraud/speeder issues)
- ✓ Well-structured quantitative survey
- ✓ Sufficient variable coverage for pattern learning
Optimal conditions:
- ✓ Subgroups under 50 respondents
- ✓ Multiple filters creating intersectional segments
- ✓ Clear business need for niche segment analysis
Not suitable for:
- ✗ Mid-sized groups (150+ respondents)
- ✗ Datasets with fundamental quality issues
- ✗ Very small studies (under 300 total respondents)
- ✗ Sparse cells with no pattern signal in broader data
Scope Limitations
The validation examined distribution accuracy and pairwise correlations. It did not test:
- Time-series or longitudinal data
- Open-ended or qualitative responses
- Certain advanced use cases
Augmentation may perform differently in these contexts. Researchers applying augmentation to these scenarios should conduct appropriate validation for their specific use case.
Note on scope: This validation focused on distribution accuracy and pairwise correlations. Independent studies by GIM (tracking studies), L'Oréal + IFOP (segmentation models), and Google (qualitative applications) have since explored time-series data, complex multivariable models, and other use cases. For readers interested in these specific contexts, our complete validation library is available.
Frequently Asked Questions About Synthetic Data Validation
Does synthetic data work for market research?
Yes, but with specific conditions. Independent validation showed synthetic augmentation improves accuracy for subgroups under 150 respondents, often doubling effective sample size. Mid-sized groups (150+ respondents) showed minimal benefit. The method works best when you need to analyze intersectional segments where multiple demographic or behavioral filters reduce sample sizes to unusable levels.
What is the difference between synthetic data and augmented data?
Augmented data strengthens small real-world subsamples by adding synthetic respondents based on patterns learned from the broader dataset. Fully synthetic data is generated entirely from scratch by AI models without any real respondent foundation. This validation tested augmentation, not fully synthetic data. Augmentation maintains connection to real survey responses while synthetic generation creates entirely artificial data points.
How accurate is synthetic data for small samples?
In validated testing, synthetic augmentation reduced error rates by up to 2.5 percentage points for very small groups (n=21) and increased effective sample size by 153-165%. Groups with n=10 saw effective sample sizes roughly triple. The accuracy improvement is most dramatic for subgroups under 50 respondents, with diminishing returns as sample sizes approach 150-200 respondents.
When should you NOT use synthetic data augmentation?
Avoid synthetic augmentation for:
- Mid-sized subgroups with 150+ respondents (minimal benefit)
- Datasets with fundamental quality issues (amplifies noise rather than signal)
- Studies with insufficient baseline data (under 300 respondents in full dataset)
- When confidence intervals are already acceptable (augmentation adds limited value)
If your starting data has poor collection practices, high fraud rates, or structural problems, address data quality first before considering augmentation.
Has synthetic data been independently validated?
Yes. Fairgen received multiple independent validations from leading market researchers from top brands and MRX agencies:
- Dig Insights (distribution accuracy and pairwise correlations)
- GIM (tracking studies and longitudinal data stability)
- L'Oréal + IFOP (enterprise-scale segmentation models)
- Google (qualitative applications and concept testing)
Each validation was conducted with full methodological control by the independent party and pre-agreed transparent publication of all findings, including limitations.
What validation metrics should I look for when evaluating synthetic data?
Look for these three complementary metrics:
- Distribution accuracy (MAE) - How closely do synthetic responses match real distributions?
- Relationship accuracy (correlation MAE) - Do patterns between variables hold up reliably?
- Effective Sample Size (ESS) - How much does statistical reliability improve?
Be skeptical of vendors showing only one metric or using proprietary "accuracy scores" without transparent methodology. Independent validation should use train/test splits to prevent overfitting.
Is this LLM-generated synthetic data?
No. This validation tested statistical augmentation based on patterns learned from real survey data—not large language model outputs. The approach doesn't use ChatGPT, Claude, or other LLMs to generate respondent personas. Statistical models identify relationships in the observed data and use those patterns to create synthetic data points that preserve distributional and correlational properties.
Does augmentation use external data sources?
No. Augmentation works entirely within your collected survey data. The algorithm learns patterns from the broader dataset (how demographics relate to behaviors and attitudes in your full sample) and applies those patterns to small subgroups. No external panels, social media data, or third-party sources are used.
When to Use Synthetic Data Augmentation: Decision Guidelines for Market Researchers
Based on these findings, here are rules of thumb for when to consider synthetic augmentation:
When It Makes Sense
Underrepresented samples with multiple filters:
The classic augmentation scenario:
- Start with nationally representative sample (n=2,000)
- Apply demographic filter: female respondents (50% → n=1,000)
- Age filter: 25-34 years old (15% → n=150)
- Income filter: $100k+ (5% → n=75)
- Geographic filter: Pacific Northwest (2% → n=15)
- Behavioral filter: frequent travelers (0.5% → n=7)
Augmentation turns n=7 "too small to analyze" into reliable subgroups.
Clear business need for niche segment analysis: When portfolio strategy, local market decisions, or product development require granular insights on specific audiences that traditional sample sizes can't support.
Well-structured quantitative data: Survey data with sufficient variable coverage where the augmentation algorithm can learn meaningful patterns. The models automatically discover relationships—you don't need to identify correlations yourself—but they need quality data to work with.
Transparent methodology requirements: Augmentation is fully explainable to stakeholders. The validation framework, statistical approach, and confidence intervals can be documented and shared, making it suitable for organizations that require methodological transparency in their research processes.
When to Avoid It
Mid-sized subgroups that are already adequate: Groups with 150+ respondents typically show minimal improvement from augmentation. If your confidence intervals are already acceptable, augmentation adds limited value.
Datasets with fundamental quality issues: If the underlying data suffers from poor collection practices, high fraud rates, or structural problems, augmentation won't fix these issues—it will amplify them. Address data quality first.
Extremely limited baseline data: Augmentation requires sufficient starting data (typically 300+ respondents in the full dataset) to learn patterns. Very small studies lack the foundation for reliable augmentation.
Questions to Ask Vendors
- What independent validation exists for your specific approach?
- On what types of data and subgroup sizes does your method work best?
- What are the documented failure conditions?
- How do you handle operational complexity of multiple boosts?
- What transparency do you provide about the augmentation methodology?
- How are stakeholders typically briefed on the approach?
Internal Checks to Run
- Compare boosted results to unboosted on a held-out sample
- Examine whether patterns align with known relationships from other research
- Document when and where augmentation was applied
- Monitor for signs of overfitting or unrealistic precision
- Prepare clear explanations of the methodology for stakeholder review
Conclusion
Across two different datasets, synthetic augmentation consistently improved accuracy and reliability in small subgroups. Distribution accuracy and relationship stability both benefited, with effective sample sizes often doubling. This means researchers can draw faster, more confident insights from niche audiences without additional fieldwork.
At the same time, clear boundaries exist. The method works best with well-structured starting data; datasets with fundamental quality issues risk amplifying noise rather than signal. Mid-sized groups showed little improvement.
What makes this validation significant isn't just the results—it's the standard it sets. In an industry where most synthetic data vendors rely on their own case studies and limited metrics, Fairgen submitted to independent, transparent validation with pre-agreed publication of all findings, including limitations. That level of methodological rigor is currently unique in the market research industry.
For insights leaders evaluating synthetic data vendors, this validation provides a clear decision framework. Fairgen's augmentation approach has been independently tested across multiple datasets, metrics, and conditions. The boundaries are documented. The failure modes are known. The improvements are quantified. The methodology can be transparently explained to stakeholders and clients.
Synthetic augmentation is a precision tool, not a universal solution. It works under specific conditions—particularly when you need to analyze intersectional segments where multiple filters reduce sample sizes to unusable levels. Trust comes from transparent validation, not vendor claims.
Subscribe to our newsletter
Learn more about Fairgen


