Is Synthetic Data in Market Research Validated? A Google Study Has Answers
Published on
February 26, 2026
Written by
Leo Gotheil

Table of contents
For market research professionals evaluating synthetic data, the most important question is not whether the technology is promising. It is whether the technology has been independently tested, with real data, by someone with no commercial interest in the outcome.
For synthetic data augmentation, that independent evidence now exists.
Minh Nguyen, PhD, Senior Marketing Research Manager at Google Japan, published a paper through ESOMAR titled Recalibrate Synthetic Data in Market Research. The paper is not a vendor white paper. It is a practitioner's framework from a researcher at one of the world's most data-literate organizations, documenting a real pilot study conducted on Fairgen's synthetic data augmentation technology, with results measured across five industry verticals and full data tables published alongside the methodology.
This article summarizes the study's key findings, their implications for research operations, and the boundaries of what the evidence supports.
Read the full paper here.
Understanding Synthetic Data Augmentation: Where It Sits in the Landscape
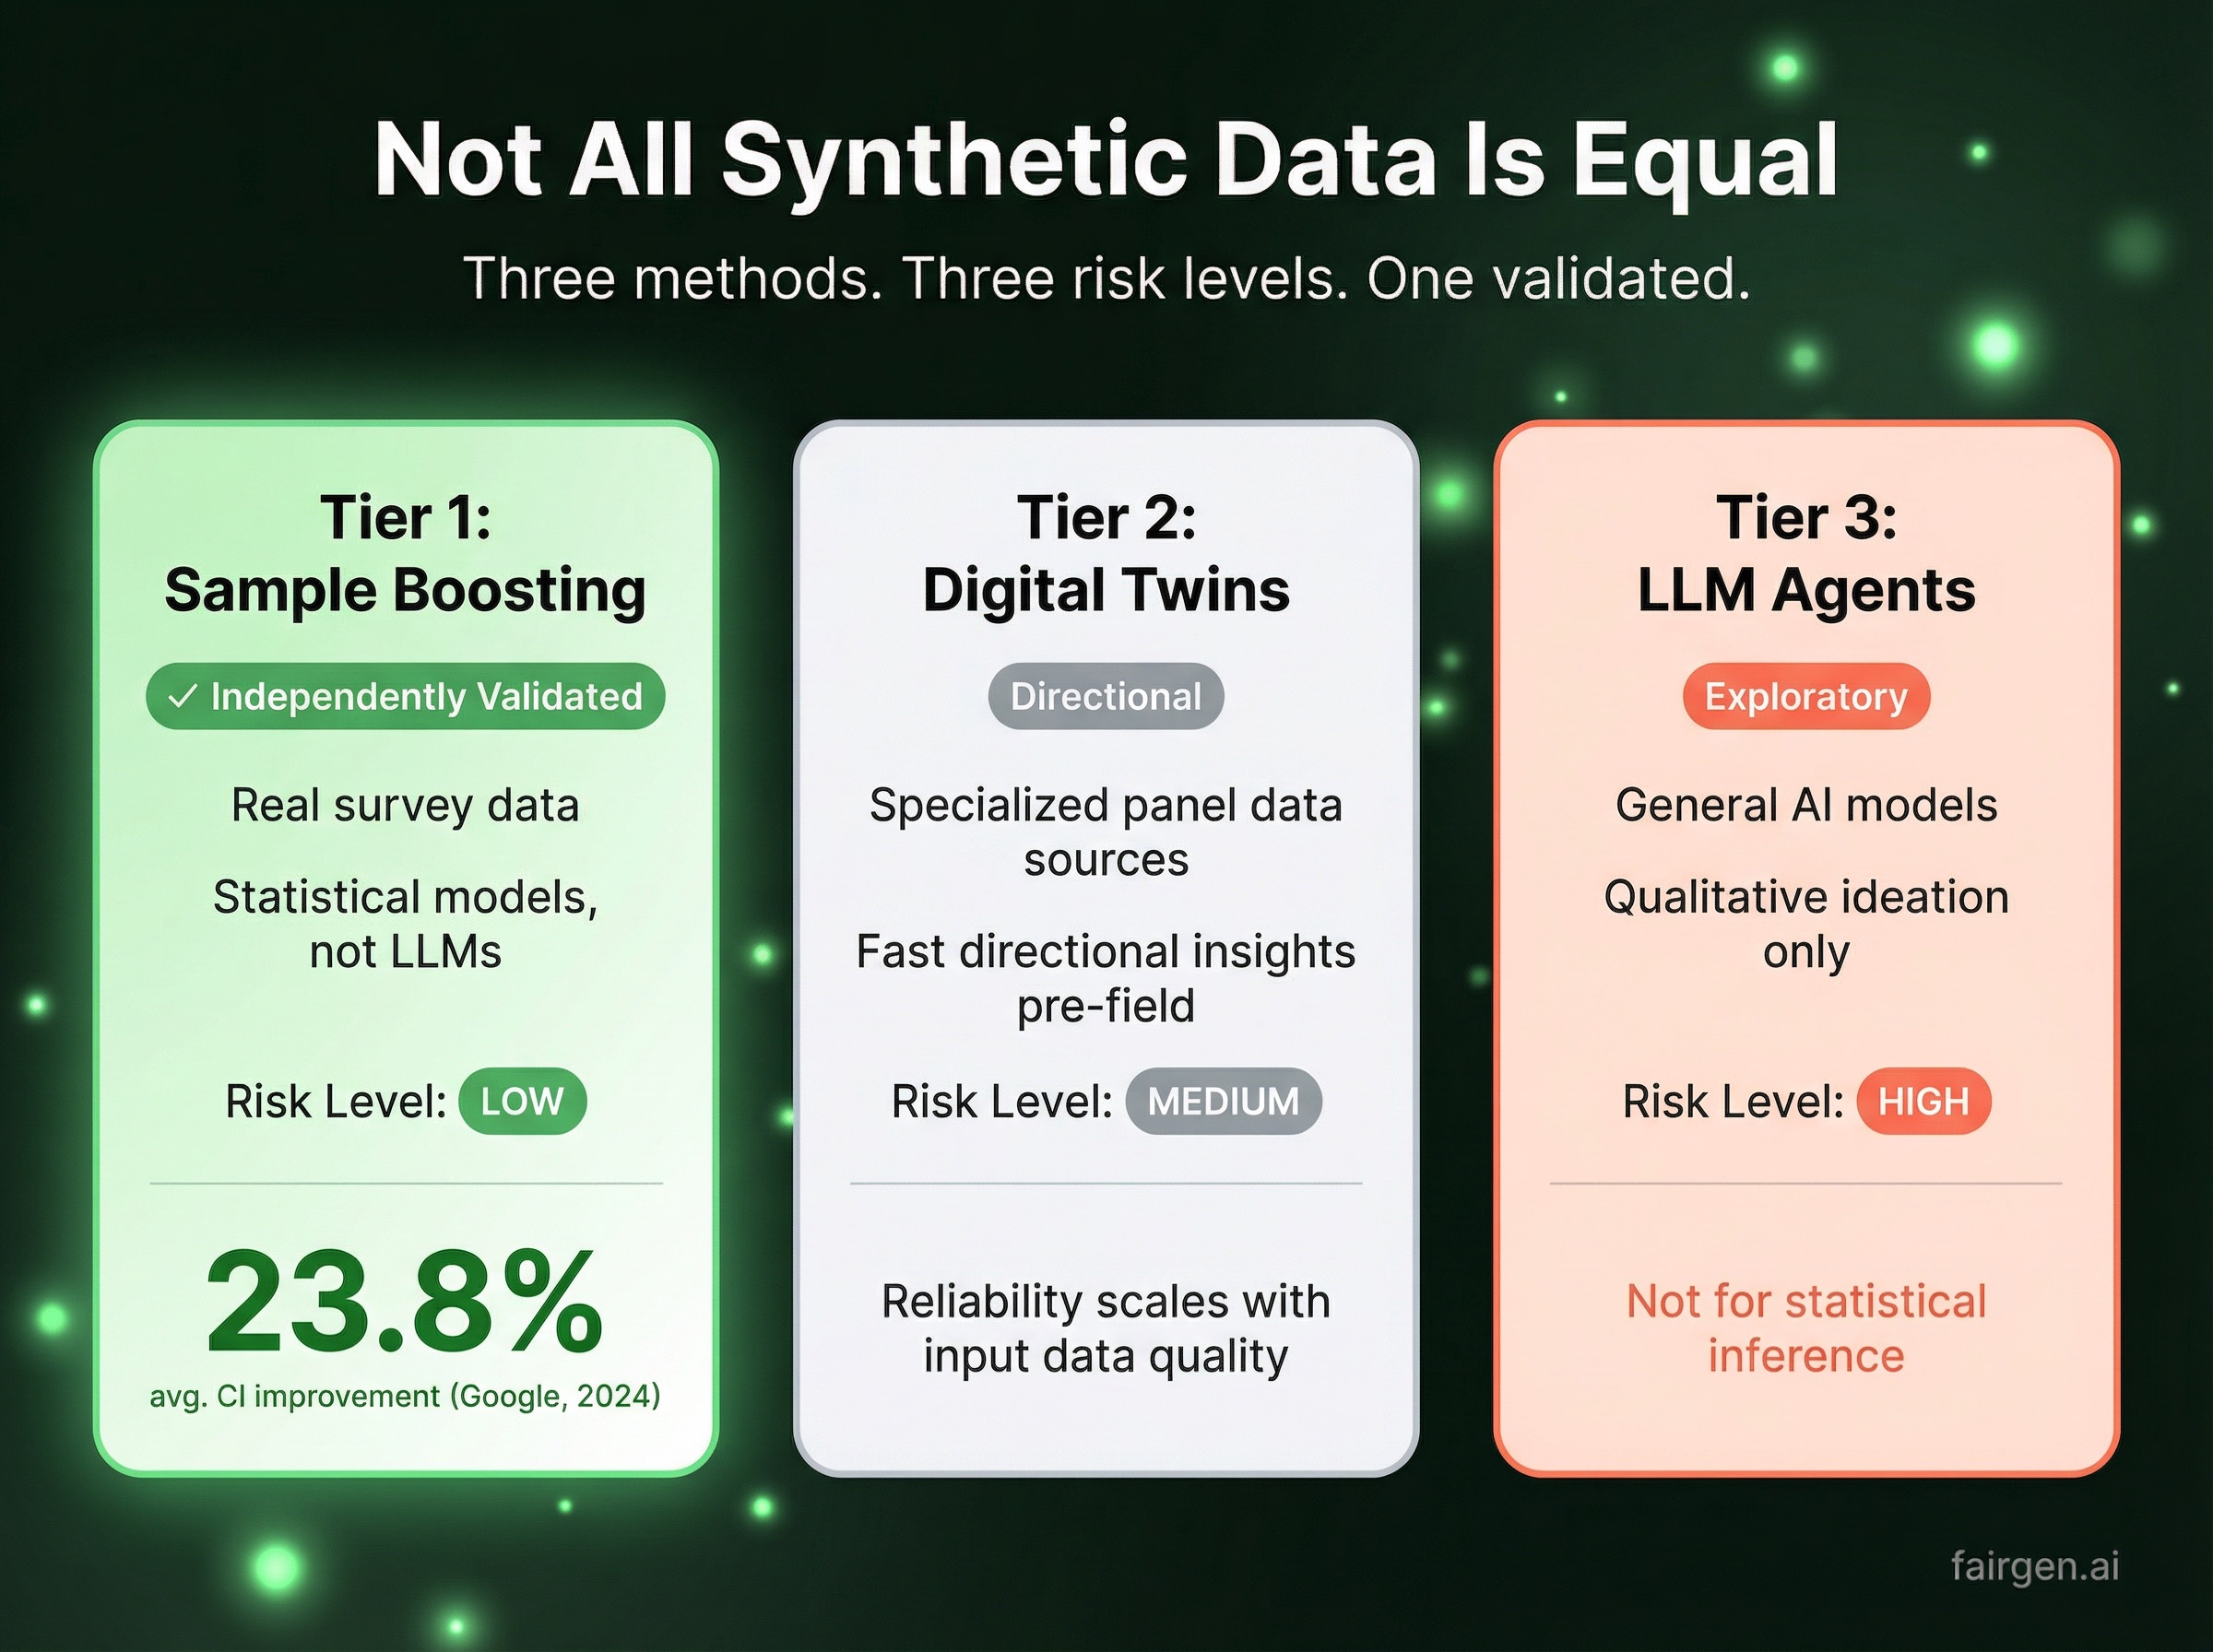
Synthetic data is not a single method. Nguyen's framework identifies three distinct approaches that are frequently conflated in industry discussions, leading either to overconfidence or premature dismissal. Understanding the differences is a prerequisite for any rigorous evaluation.
Synthetic Data Augmentation (Sample Boosting)
Synthetic data augmentation is the most methodologically mature approach in market research today. Statistical models are trained on real survey data to learn co-occurrence patterns across variables: demographics, stated behaviors, attitudes, and survey skip logic. Those models then generate additional synthetic respondents that are statistically representative of an underrepresented subgroup.
It is important to clarify what this method is not. Synthetic data augmentation is not an LLM application. No large language model is generating responses from a prompt. The output is produced entirely by statistical models trained on real respondent data, extrapolating within validated statistical boundaries. Output is close-ended, quantitative, and verifiable against holdout samples. This is the method tested in the Google pilot study.
Digital Twins
Digital twins take a more expansive approach, building an interactive digital representation of a target audience from high-quality panel data. When constructed from rich, verticalized data with genuine depth in a specific industry or audience segment, digital twins can deliver fast directional insights that would otherwise require weeks of fieldwork. They are particularly well suited to concept screening and positioning pressure-tests before going to field. The reliability of directional output scales directly with the specialization and quality of the underlying data source.
A dedicated analysis of digital twins in market research is forthcoming on this blog.
LLM-Based Synthetic Respondents
The most generative of the three approaches, LLM-based synthetic respondents use large language models to simulate AI personas answering survey questions from a defined perspective. This method serves legitimate purposes in early-stage ideation and creative exploration. It is not appropriate as a substitute for statistical inference, and outputs should be treated as directional rather than evidential.
The Google Pilot Study: Methodology and Results
The pilot study applied Fairgen's Boost technology to real brand lift survey data processed through Google's Ads Data Hub infrastructure. Brand lift measurement presents one of the most constrained statistical challenges in market research: ad-exposed respondent groups are inherently small by design, and achieving statistically significant results typically requires either disproportionate media investment or accepting confidence intervals too wide to support actionable decisions.
The study's objective was precise: to quantify how much statistical precision is recoverable through synthetic data augmentation, at what sample sizes, and across which research categories. The pilot covered 52 study cuts across five industry verticals: real estate, pharmaceuticals, FMCG, healthcare, and entertainment.
Primary finding: 23.8% average improvement in confidence intervals, with results ranging from 3.2% to 39.9% depending on original sample characteristics. Prediction accuracy also improved, with average error reduced by 24.76% across 10 boost iterations on randomly split validation samples.
The breakdown by original sample size is particularly instructive for research teams assessing where augmentation delivers value:
The relationship is consistent: the smaller the original sample, the greater the statistical improvement. This is precisely the domain where synthetic data augmentation offers the most meaningful contribution, and where conventional statistical approaches have the least leverage.
The margin of error analysis reinforces the same pattern:
The more statistically constrained the source data, the greater the recoverable precision gain. Research teams working with tracker sub-groups that fall below reliable thresholds, multi-market studies with low sub-brand penetration, or hard-to-reach audience segments that cannot be cost-effectively oversampled will find the most direct applicability in these results.
Technical Requirements for Valid Augmentation
The study specifies the conditions under which synthetic data augmentation produces valid results. These requirements are foundational to any rigorous deployment and are worth examining closely:
- Minimum base sample of n=300 completed respondents in the source dataset
- Close-ended, quantitative fields only. Open-ended survey responses cannot be augmented by statistical models
- Explicit survey logic configuration. Multi-select groups must be clearly defined prior to augmentation to ensure 100% compliance
The pilot tested 11 distinct survey logic patterns. All 11 demonstrated 100% compliance. This result is a function of careful configuration, not an automatic property of the technology.
The Boundaries of the Method
Nguyen's paper is notable in part for its explicit statement of where synthetic data augmentation is not the appropriate tool. These boundaries are as important as the performance results for any research team conducting a rigorous evaluation.
Qualitative and open-ended data. Statistical augmentation applies exclusively to quantitative, close-ended fields. Verbatims, open-ended brand perceptions, and exploratory qualitative data cannot be replicated by statistical models and remain firmly within the domain of real human research.
Bias propagation. Statistical models learn from their training data, including any embedded biases. An original dataset that over-represents a particular respondent profile within a niche segment will produce synthetic data reflecting that same imbalance. Holdout sample validation is the standard mechanism for quantifying this risk; it does not eliminate it.
Mid-sized segments. The performance data is unambiguous: segments in the n=100 to n=200 range demonstrate limited and sometimes negligible improvement. Research needs concentrated in this range are better served by other methods.
A willingness to define these boundaries clearly is, itself, a meaningful signal of methodological credibility in any synthetic data vendor relationship.
The Broader Validation Picture: Five Independent Studies
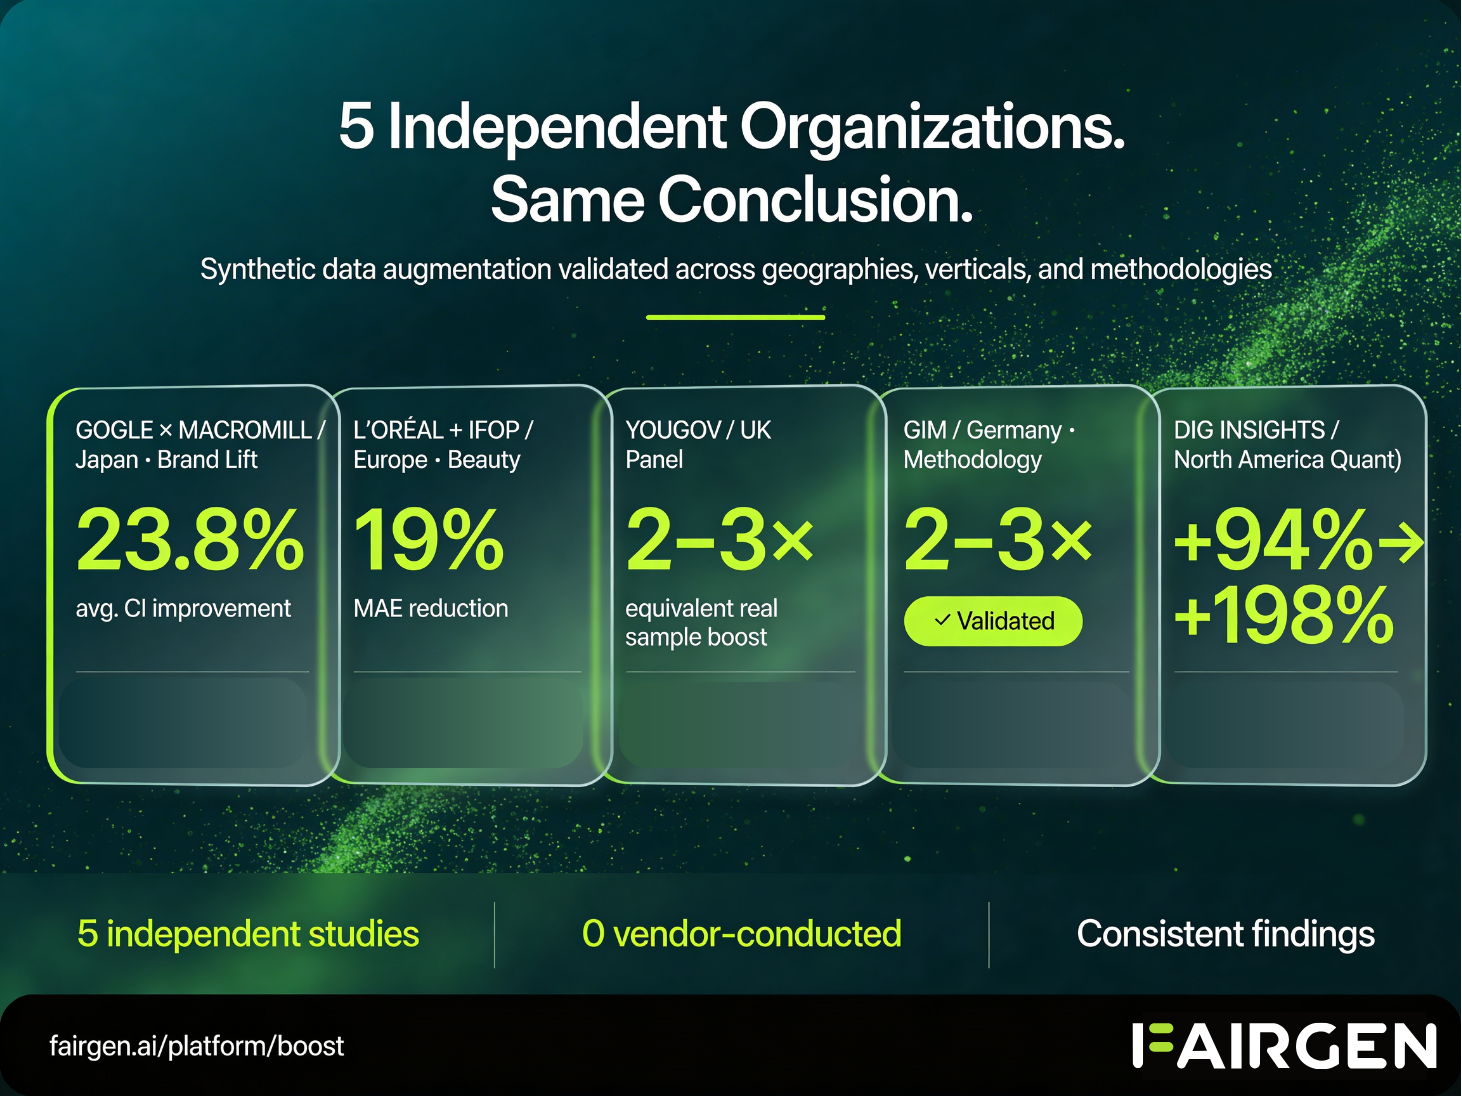
The Google pilot study is one of five independent validations of Fairgen's synthetic data augmentation approach, each conducted by a third-party organization with no commercial interest in the outcome, across different geographies, research categories, and evaluation methodologies.
The convergence across all five constitutes methodological evidence rather than isolated proof of concept:
- Google / Macromill: 23.8% average CI improvement on brand lift studies (52 cuts, 5 verticals)
- L'Oréal + IFOP: 19% MAE reduction on aggregate; up to 32% improvement in specific cells across European beauty market data
- YouGov: Confidence interval reduction equivalent to a 2 to 3x real sample boost
- GIM: Methodology validated across European research datasets
- Dig Insights: ESS improvement of +94% to +198% for segments at n=20 to 50; +153% to +198% for segments at n=7 to 15
Five organizations. Different datasets. Different verticals. Different evaluation criteria. Consistent directional findings across all five.
Validation Best Practices for Research Teams
Nguyen's paper outlines three validation practices that should be considered standard operating procedure for any team deploying synthetic data augmentation:
Holdout sample testing. Before incorporating augmented data into analysis, a portion of the real source data should be reserved as a ground-truth holdout. Testing statistical model accuracy against this holdout is the most direct measure of whether the synthetic data accurately represents the real population.
Sensitivity analysis. Analytical conclusions should be rerun without the synthetic data component. If a finding reverses entirely without augmentation, the synthetic data is carrying too much analytical weight. If conclusions hold directionally, the statistical model is performing its intended function: reducing variance while preserving the underlying signal.
Qualitative validation. For unexpected findings generated from augmented data, a limited set of real respondent interviews provides confirmatory grounding that statistical models cannot supply. Synthetic data augmentation performs most reliably when used to quantify and refine what researchers already have substantive reason to expect. It is less suited to surfacing genuinely novel findings.
Implications for Research Operations
The practical implication of Nguyen's study is specific: synthetic data augmentation is a validated and measurable option for the class of research problems where traditional fieldwork methods are most constrained.
Research teams working with niche segments that fall below analytically reliable thresholds, sub-groups within multi-country tracking programs that cannot be meaningfully analyzed at the market level, or audience segments for whom cost-effective oversampling is not achievable will find the most direct application in this evidence.
The validated position of synthetic data augmentation in the research toolkit is as follows: primary fieldwork with real respondents remains the methodological gold standard wherever it is feasible. Where it is not feasible, due to audience scale, budget, or timeline constraints, synthetic data augmentation is the most rigorously independently tested alternative currently available.
Read the full paper here.
Explore the Technology
Fairgen Boost is the statistical augmentation technology independently validated across all five studies referenced in this article. Research teams can review the full methodology and run a trial on their own data at fairgen.ai.
Have questions about whether synthetic data augmentation is appropriate for your research programs? Speak with the Fairgen team
Frequently Asked Questions
What is synthetic data augmentation in market research? Synthetic data augmentation in market research is the process of using statistical models trained on real survey data to generate additional synthetic respondents that are statistically representative of an underrepresented subgroup. It is distinct from LLM-based approaches: no language model is involved. Output is quantitative, close-ended, and verifiable against holdout samples.
Is synthetic data augmentation validated for market research use? Yes. As of 2025, five independent third-party studies have validated synthetic data augmentation in market research settings, conducted by Google, L'Oréal and IFOP, YouGov, GIM, and Dig Insights. The Google pilot, published through ESOMAR by Minh Nguyen PhD, documented a 23.8% average confidence interval improvement across 52 brand lift study cuts.
What sample size is required for synthetic data augmentation to work?A minimum base sample of n=300 completed respondents is required in the source dataset. The method delivers its greatest statistical improvement on segments below n=50, where average confidence interval improvement reaches 32.3% according to the Google pilot study.
Does synthetic data augmentation use LLMs? No. Synthetic data augmentation uses statistical models trained exclusively on real survey data. It does not use large language models or generative AI to produce responses. This distinction is critical for methodological validity: outputs are derived from statistical patterns in actual respondent data, not from language model priors.
What types of survey data can be synthetically augmented? Only close-ended, quantitative survey fields can be augmented. Open-ended responses, verbatims, and qualitative data cannot be replicated by statistical models and fall outside the scope of synthetic augmentation entirely.
What is the difference between synthetic data augmentation and digital twins in market research? Synthetic data augmentation uses statistical models to expand an existing dataset, adding synthetic respondents to underrepresented subgroups within a survey. Digital twins build an interactive representation of a target audience from rich historical panel data, enabling rapid directional testing before fieldwork. Augmentation is the more statistically validated approach for quantitative research; digital twins are better suited to directional concept screening, particularly when built on high-quality, vertically specialized panel data.
How should research teams validate synthetic data in their own workflows? Three practices are recommended: holdout sample testing, where a portion of real data is reserved and used to measure model accuracy before augmentation is incorporated; sensitivity analysis, where conclusions are rerun without synthetic data to confirm the finding holds directionally; and qualitative follow-up on unexpected findings to provide confirmatory grounding.
Which market research use cases benefit most from synthetic data augmentation? The strongest use cases are niche subgroup analysis where original sample sizes fall below n=100, tracker sub-groups in multi-market studies that cannot be analyzed reliably at the market level, hard-to-reach audience segments that cannot be cost-effectively oversampled, and brand lift measurement on small ad-exposed groups.
Related reading:
- How T-Mobile expanded from 21 to 98 analyzable markets without additional fieldwork
- The L'Oréal + IFOP validation study: methodology and results
- Explore Fairgen Boost: the technology behind all five studies
For market research professionals evaluating synthetic data, the most important question is not whether the technology is promising. It is whether the technology has been independently tested, with real data, by someone with no commercial interest in the outcome.
For synthetic data augmentation, that independent evidence now exists.
Minh Nguyen, PhD, Senior Marketing Research Manager at Google Japan, published a paper through ESOMAR titled Recalibrate Synthetic Data in Market Research. The paper is not a vendor white paper. It is a practitioner's framework from a researcher at one of the world's most data-literate organizations, documenting a real pilot study conducted on Fairgen's synthetic data augmentation technology, with results measured across five industry verticals and full data tables published alongside the methodology.
This article summarizes the study's key findings, their implications for research operations, and the boundaries of what the evidence supports.
Read the full paper here.
Understanding Synthetic Data Augmentation: Where It Sits in the Landscape
Synthetic data is not a single method. Nguyen's framework identifies three distinct approaches that are frequently conflated in industry discussions, leading either to overconfidence or premature dismissal. Understanding the differences is a prerequisite for any rigorous evaluation.
Synthetic Data Augmentation (Sample Boosting)
Synthetic data augmentation is the most methodologically mature approach in market research today. Statistical models are trained on real survey data to learn co-occurrence patterns across variables: demographics, stated behaviors, attitudes, and survey skip logic. Those models then generate additional synthetic respondents that are statistically representative of an underrepresented subgroup.
It is important to clarify what this method is not. Synthetic data augmentation is not an LLM application. No large language model is generating responses from a prompt. The output is produced entirely by statistical models trained on real respondent data, extrapolating within validated statistical boundaries. Output is close-ended, quantitative, and verifiable against holdout samples. This is the method tested in the Google pilot study.
Digital Twins
Digital twins take a more expansive approach, building an interactive digital representation of a target audience from high-quality panel data. When constructed from rich, verticalized data with genuine depth in a specific industry or audience segment, digital twins can deliver fast directional insights that would otherwise require weeks of fieldwork. They are particularly well suited to concept screening and positioning pressure-tests before going to field. The reliability of directional output scales directly with the specialization and quality of the underlying data source.
A dedicated analysis of digital twins in market research is forthcoming on this blog.
LLM-Based Synthetic Respondents
The most generative of the three approaches, LLM-based synthetic respondents use large language models to simulate AI personas answering survey questions from a defined perspective. This method serves legitimate purposes in early-stage ideation and creative exploration. It is not appropriate as a substitute for statistical inference, and outputs should be treated as directional rather than evidential.
The Google Pilot Study: Methodology and Results
The pilot study applied Fairgen's Boost technology to real brand lift survey data processed through Google's Ads Data Hub infrastructure. Brand lift measurement presents one of the most constrained statistical challenges in market research: ad-exposed respondent groups are inherently small by design, and achieving statistically significant results typically requires either disproportionate media investment or accepting confidence intervals too wide to support actionable decisions.
The study's objective was precise: to quantify how much statistical precision is recoverable through synthetic data augmentation, at what sample sizes, and across which research categories. The pilot covered 52 study cuts across five industry verticals: real estate, pharmaceuticals, FMCG, healthcare, and entertainment.
Primary finding: 23.8% average improvement in confidence intervals, with results ranging from 3.2% to 39.9% depending on original sample characteristics. Prediction accuracy also improved, with average error reduced by 24.76% across 10 boost iterations on randomly split validation samples.
The breakdown by original sample size is particularly instructive for research teams assessing where augmentation delivers value:
The relationship is consistent: the smaller the original sample, the greater the statistical improvement. This is precisely the domain where synthetic data augmentation offers the most meaningful contribution, and where conventional statistical approaches have the least leverage.
The margin of error analysis reinforces the same pattern:
The more statistically constrained the source data, the greater the recoverable precision gain. Research teams working with tracker sub-groups that fall below reliable thresholds, multi-market studies with low sub-brand penetration, or hard-to-reach audience segments that cannot be cost-effectively oversampled will find the most direct applicability in these results.
Technical Requirements for Valid Augmentation
The study specifies the conditions under which synthetic data augmentation produces valid results. These requirements are foundational to any rigorous deployment and are worth examining closely:
- Minimum base sample of n=300 completed respondents in the source dataset
- Close-ended, quantitative fields only. Open-ended survey responses cannot be augmented by statistical models
- Explicit survey logic configuration. Multi-select groups must be clearly defined prior to augmentation to ensure 100% compliance
The pilot tested 11 distinct survey logic patterns. All 11 demonstrated 100% compliance. This result is a function of careful configuration, not an automatic property of the technology.
The Boundaries of the Method
Nguyen's paper is notable in part for its explicit statement of where synthetic data augmentation is not the appropriate tool. These boundaries are as important as the performance results for any research team conducting a rigorous evaluation.
Qualitative and open-ended data. Statistical augmentation applies exclusively to quantitative, close-ended fields. Verbatims, open-ended brand perceptions, and exploratory qualitative data cannot be replicated by statistical models and remain firmly within the domain of real human research.
Bias propagation. Statistical models learn from their training data, including any embedded biases. An original dataset that over-represents a particular respondent profile within a niche segment will produce synthetic data reflecting that same imbalance. Holdout sample validation is the standard mechanism for quantifying this risk; it does not eliminate it.
Mid-sized segments. The performance data is unambiguous: segments in the n=100 to n=200 range demonstrate limited and sometimes negligible improvement. Research needs concentrated in this range are better served by other methods.
A willingness to define these boundaries clearly is, itself, a meaningful signal of methodological credibility in any synthetic data vendor relationship.
The Broader Validation Picture: Five Independent Studies
The Google pilot study is one of five independent validations of Fairgen's synthetic data augmentation approach, each conducted by a third-party organization with no commercial interest in the outcome, across different geographies, research categories, and evaluation methodologies.
The convergence across all five constitutes methodological evidence rather than isolated proof of concept:
- Google / Macromill: 23.8% average CI improvement on brand lift studies (52 cuts, 5 verticals)
- L'Oréal + IFOP: 19% MAE reduction on aggregate; up to 32% improvement in specific cells across European beauty market data
- YouGov: Confidence interval reduction equivalent to a 2 to 3x real sample boost
- GIM: Methodology validated across European research datasets
- Dig Insights: ESS improvement of +94% to +198% for segments at n=20 to 50; +153% to +198% for segments at n=7 to 15
Five organizations. Different datasets. Different verticals. Different evaluation criteria. Consistent directional findings across all five.
Validation Best Practices for Research Teams
Nguyen's paper outlines three validation practices that should be considered standard operating procedure for any team deploying synthetic data augmentation:
Holdout sample testing. Before incorporating augmented data into analysis, a portion of the real source data should be reserved as a ground-truth holdout. Testing statistical model accuracy against this holdout is the most direct measure of whether the synthetic data accurately represents the real population.
Sensitivity analysis. Analytical conclusions should be rerun without the synthetic data component. If a finding reverses entirely without augmentation, the synthetic data is carrying too much analytical weight. If conclusions hold directionally, the statistical model is performing its intended function: reducing variance while preserving the underlying signal.
Qualitative validation. For unexpected findings generated from augmented data, a limited set of real respondent interviews provides confirmatory grounding that statistical models cannot supply. Synthetic data augmentation performs most reliably when used to quantify and refine what researchers already have substantive reason to expect. It is less suited to surfacing genuinely novel findings.
Implications for Research Operations
The practical implication of Nguyen's study is specific: synthetic data augmentation is a validated and measurable option for the class of research problems where traditional fieldwork methods are most constrained.
Research teams working with niche segments that fall below analytically reliable thresholds, sub-groups within multi-country tracking programs that cannot be meaningfully analyzed at the market level, or audience segments for whom cost-effective oversampling is not achievable will find the most direct application in this evidence.
The validated position of synthetic data augmentation in the research toolkit is as follows: primary fieldwork with real respondents remains the methodological gold standard wherever it is feasible. Where it is not feasible, due to audience scale, budget, or timeline constraints, synthetic data augmentation is the most rigorously independently tested alternative currently available.
Read the full paper here.
Explore the Technology
Fairgen Boost is the statistical augmentation technology independently validated across all five studies referenced in this article. Research teams can review the full methodology and run a trial on their own data at fairgen.ai.
Have questions about whether synthetic data augmentation is appropriate for your research programs? Speak with the Fairgen team
Frequently Asked Questions
What is synthetic data augmentation in market research? Synthetic data augmentation in market research is the process of using statistical models trained on real survey data to generate additional synthetic respondents that are statistically representative of an underrepresented subgroup. It is distinct from LLM-based approaches: no language model is involved. Output is quantitative, close-ended, and verifiable against holdout samples.
Is synthetic data augmentation validated for market research use? Yes. As of 2025, five independent third-party studies have validated synthetic data augmentation in market research settings, conducted by Google, L'Oréal and IFOP, YouGov, GIM, and Dig Insights. The Google pilot, published through ESOMAR by Minh Nguyen PhD, documented a 23.8% average confidence interval improvement across 52 brand lift study cuts.
What sample size is required for synthetic data augmentation to work?A minimum base sample of n=300 completed respondents is required in the source dataset. The method delivers its greatest statistical improvement on segments below n=50, where average confidence interval improvement reaches 32.3% according to the Google pilot study.
Does synthetic data augmentation use LLMs? No. Synthetic data augmentation uses statistical models trained exclusively on real survey data. It does not use large language models or generative AI to produce responses. This distinction is critical for methodological validity: outputs are derived from statistical patterns in actual respondent data, not from language model priors.
What types of survey data can be synthetically augmented? Only close-ended, quantitative survey fields can be augmented. Open-ended responses, verbatims, and qualitative data cannot be replicated by statistical models and fall outside the scope of synthetic augmentation entirely.
What is the difference between synthetic data augmentation and digital twins in market research? Synthetic data augmentation uses statistical models to expand an existing dataset, adding synthetic respondents to underrepresented subgroups within a survey. Digital twins build an interactive representation of a target audience from rich historical panel data, enabling rapid directional testing before fieldwork. Augmentation is the more statistically validated approach for quantitative research; digital twins are better suited to directional concept screening, particularly when built on high-quality, vertically specialized panel data.
How should research teams validate synthetic data in their own workflows? Three practices are recommended: holdout sample testing, where a portion of real data is reserved and used to measure model accuracy before augmentation is incorporated; sensitivity analysis, where conclusions are rerun without synthetic data to confirm the finding holds directionally; and qualitative follow-up on unexpected findings to provide confirmatory grounding.
Which market research use cases benefit most from synthetic data augmentation? The strongest use cases are niche subgroup analysis where original sample sizes fall below n=100, tracker sub-groups in multi-market studies that cannot be analyzed reliably at the market level, hard-to-reach audience segments that cannot be cost-effectively oversampled, and brand lift measurement on small ad-exposed groups.
Related reading:
- How T-Mobile expanded from 21 to 98 analyzable markets without additional fieldwork
- The L'Oréal + IFOP validation study: methodology and results
- Explore Fairgen Boost: the technology behind all five studies
Subscribe to our newsletter
Learn more about Fairgen


.png)


